/Users/wheatley/Documents/Solar/NuStar/specfiles/nu80610208001A06_chu12_N_sr_orbit8_2039_2042.arf /Users/wheatley/Documents/Solar/NuStar/specfiles/nu80610208001A06_chu12_N_sr_orbit8_2039_2042.rmf /Users/wheatley/Documents/Solar/NuStar/specfiles/nu80610208001B06_chu12_N_sr_orbit8_2039_2042.arf /Users/wheatley/Documents/Solar/NuStar/specfiles/nu80610208001B06_chu12_N_sr_orbit8_2039_2042.rmf /Users/wheatley/Documents/Solar/NuStar/specfiles/nu80610208001A06_chu12_N_sr_orbit8_2037_2050.arf /Users/wheatley/Documents/Solar/NuStar/specfiles/nu80610208001A06_chu12_N_sr_orbit8_2037_2050.rmf /Users/wheatley/Documents/Solar/NuStar/specfiles/nu80610208001B06_chu12_N_sr_orbit8_2037_2050.arf /Users/wheatley/Documents/Solar/NuStar/specfiles/nu80610208001B06_chu12_N_sr_orbit8_2037_2050.rmf /Users/wheatley/Documents/Solar/NuStar/specfiles/nu80610208001A06_chu12_N_sr_orbit8_2039_2045.arf /Users/wheatley/Documents/Solar/NuStar/specfiles/nu80610208001A06_chu12_N_sr_orbit8_2039_2045.rmf /Users/wheatley/Documents/Solar/NuStar/specfiles/nu80610208001B06_chu12_N_sr_orbit8_2039_2045.arf /Users/wheatley/Documents/Solar/NuStar/specfiles/nu80610208001B06_chu12_N_sr_orbit8_2039_2045.rmf
identical for A and B over the given time ranges
aia_contours=[75,80,85] #also no large correlation
xrt_submap_radii=[4,7,10] #nustar radii no effect really
xrt_facs=[1,1.5,2,2.5] #multiplicative factor for data
nustar_facs=[.5,1,1.5,2]
nustar_areas=['AIA','XRT'] #which instrument does NuSTAR take the area measurement from
min_errs=[.1,.15,.2]
#initial_weightvals=['guess','loci_min',6.5] #identical results with 'guess' and 6
bpdict['timerange']=s1tr
best_dem=joint_DEM(**bpdict, tstart=tstart,tend=tend)
bdf=best_dem.run_from_inputs()
all maps same dimensions all maps same dimensions all maps same dimensions all maps same dimensions all maps same dimensions all maps same dimensions not transposed nustar cutout coords: <SkyCoord (Helioprojective: obstime=2020-09-12 20:39:08.832000, rsun=695508000.0 m, observer=<HeliographicStonyhurst Coordinate (obstime=2020-09-12 20:39:08.832000): (lon, lat, radius) in (deg, deg, m) (0., 7.22963878, 1.50532105e+11)>): (Tx, Ty) in arcsec (-963.75808695, 147.39076468)> <SkyCoord (Helioprojective: obstime=2020-09-12 20:39:08.832000, rsun=695508000.0 m, observer=<HeliographicStonyhurst Coordinate (obstime=2020-09-12 20:39:08.832000): (lon, lat, radius) in (deg, deg, m) (0., 7.22963878, 1.50532105e+11)>): (Tx, Ty) in arcsec (-853.75808695, 257.39076468)> [3.69424930e+00 5.18546849e+01 6.57783664e+02 1.16438373e+03 5.18235735e+02 2.92784569e+01 9.85055542e+00 2.12063981e-01] Input data and errors: 94 : 3.69 2.98 81 % 131 : 51.85 10.23 20 % 171 : 657.78 71.18 11 % 193 : 1164.38 121.16 10 % 211 : 518.24 56.06 11 % 335 : 29.28 5.18 18 % Be-Thin : 19.70 3.94 20 % NuSTAR 2.5-3.5 keV : 0.42 0.08 20 % chisq: 1.013632 AIA DN_reg/DN_in ratio: 0.8464033483586682 Xray DN_reg/DN_in ratio: 0.9969143829711613
bdf[kkeys]
aia_area | aia_contour | chisq | nustar_fac | xrt_area | xrt_fac | xrt_submap_radius | aia_ratio | xray_ratio | |
---|---|---|---|---|---|---|---|---|---|
0 | 1.916528e+16 | 75.0 | 1.013632 | 2.0 | 8.110882e+17 | 2.0 | 7.0 | 0.846403 | 0.996914 |
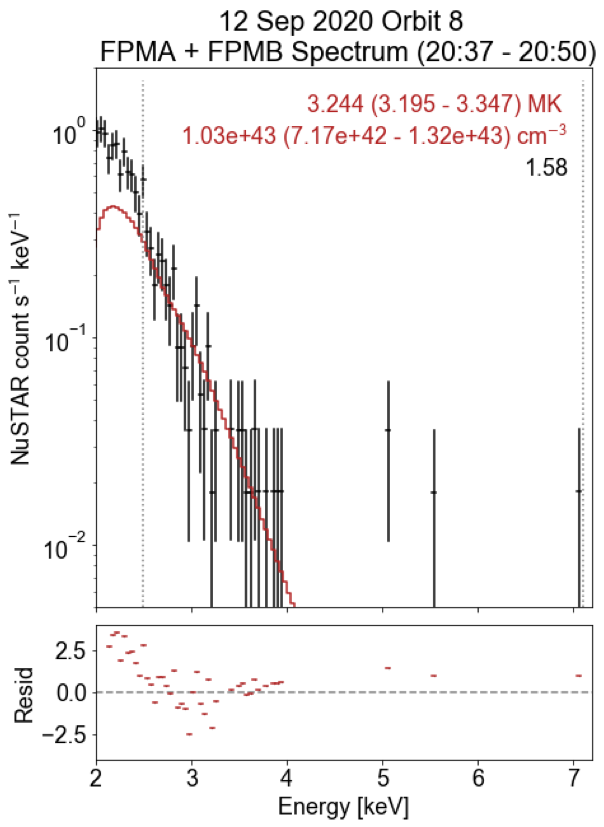
(these results were using the longest time range, so that might explain why they match up poorly compared to the ones using the shorter peak timerange)
#make the area actually equal...
ea_dem=joint_DEM(**bpdict,tstart=tstart,tend=tend)
ea_dem.xrt_submap_radius=3
#ea_dem.xrt_max=True
ea_dem.aia_contour=40
ea_dem.xrt_fac=1
ea_dem.nustar_fac=1
edf=ea_dem.run_from_inputs()
edf[['aia_area','xrt_area']]
all maps same dimensions all maps same dimensions all maps same dimensions all maps same dimensions all maps same dimensions all maps same dimensions not transposed nustar cutout coords: <SkyCoord (Helioprojective: obstime=2020-09-12 20:39:08.832000, rsun=695508000.0 m, observer=<HeliographicStonyhurst Coordinate (obstime=2020-09-12 20:39:08.832000): (lon, lat, radius) in (deg, deg, m) (0., 7.22963878, 1.50532105e+11)>): (Tx, Ty) in arcsec (-963.75808695, 147.39076468)> <SkyCoord (Helioprojective: obstime=2020-09-12 20:39:08.832000, rsun=695508000.0 m, observer=<HeliographicStonyhurst Coordinate (obstime=2020-09-12 20:39:08.832000): (lon, lat, radius) in (deg, deg, m) (0., 7.22963878, 1.50532105e+11)>): (Tx, Ty) in arcsec (-853.75808695, 257.39076468)> [3.14526019e+00 3.93592595e+01 5.90691413e+02 9.13980512e+02 3.29642496e+02 1.96708476e+01 2.60899048e+01 2.12063981e-01] Input data and errors: 94 : 3.15 2.78 88 % 131 : 39.36 8.66 22 % 171 : 590.69 64.45 11 % 193 : 913.98 96.09 11 % 211 : 329.64 37.12 11 % 335 : 19.67 4.08 21 % Be-Thin : 26.09 5.22 20 % NuSTAR 2.5-3.5 keV : 0.21 0.04 20 % chisq: 23.494525 AIA DN_reg/DN_in ratio: 0.22670329279597948 Xray DN_reg/DN_in ratio: 0.532984602173606
aia_area | xrt_area | |
---|---|---|
0 | 1.609883e+17 | 1.802418e+17 |
<matplotlib.image.AxesImage at 0x7fc4473a10b8>
using counts from images - for publication, use counts from .pha files (need Sarah to generate them for given timerange)
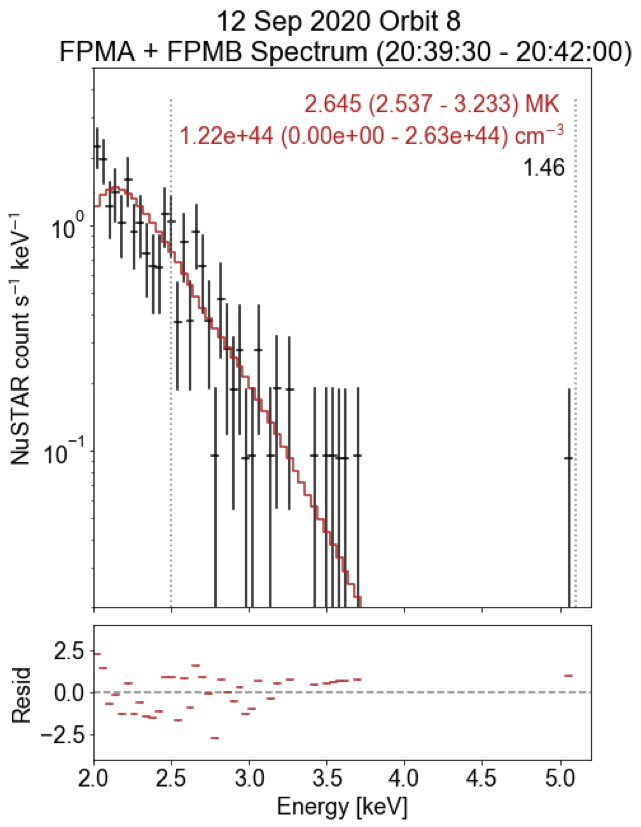
bpdict
{'aia_contour': 75.0, 'nustar_fac': 2.0, 'timerange': ['2020-09-12T20:39:00', '2020-09-12T20:42:00'], 'xrt_fac': 2.0, 'xrt_submap_radius': 7.0}
eadict
{'aia_contour': 40.0, 'nustar_fac': 1.0, 'xrt_fac': 1.0, 'xrt_submap_radius': 3.0}